In this tutorial, we’ll install Elasticsearch, Kibana, and Logstash which is usually called Elastic Stack. Elasticsearch is usually used for centralized logging, its competitor like Datadog, Sumologic etc.
When installing Elastic Stack, we must use the same version across all applications. In this tutorial, we’ll install Kibana 8.0.1, Elasticsearch 8.0.1 and Logstash 8.0.1, which is the latest version at the time of this writing.
System Requirement
The minimum requirement for Elastic Stack installation
2 GB Memory
10 GB Storage (SSD Prefered)
1 CPU
For this tutorial, I’m using
8 GB Memory
256 GB SSD
4 CPU AMD Ryzen 3 3200G
1. Initial Setup
After the Debian 11 installation is complete, no matter if you use the template from your cloud provider or install the minimalist/desktop version, this tutorial should work for you as well.
Install Dependency
sudo apt install curl socat wget gnupg apt-transport-https -y
Set Server Timezone
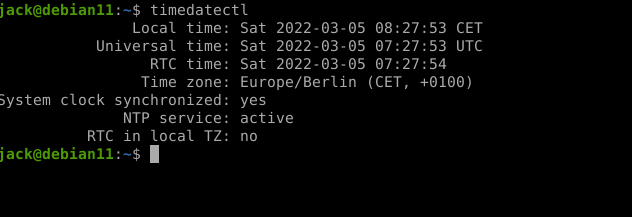
Set the server time your local time, to make it easier to check on the logs later when we need it.
sudo timedatectl set-ntp true
sudo timedatectl set-timezone "Europe/Berlin"
# verify it's working
timedatectl
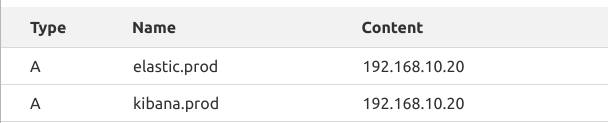
Setup DNS for SSL
We’ll use SSL/HTTPS to connect to Kibana or Elasticsearch, to make it happen. First setup the DNS for both
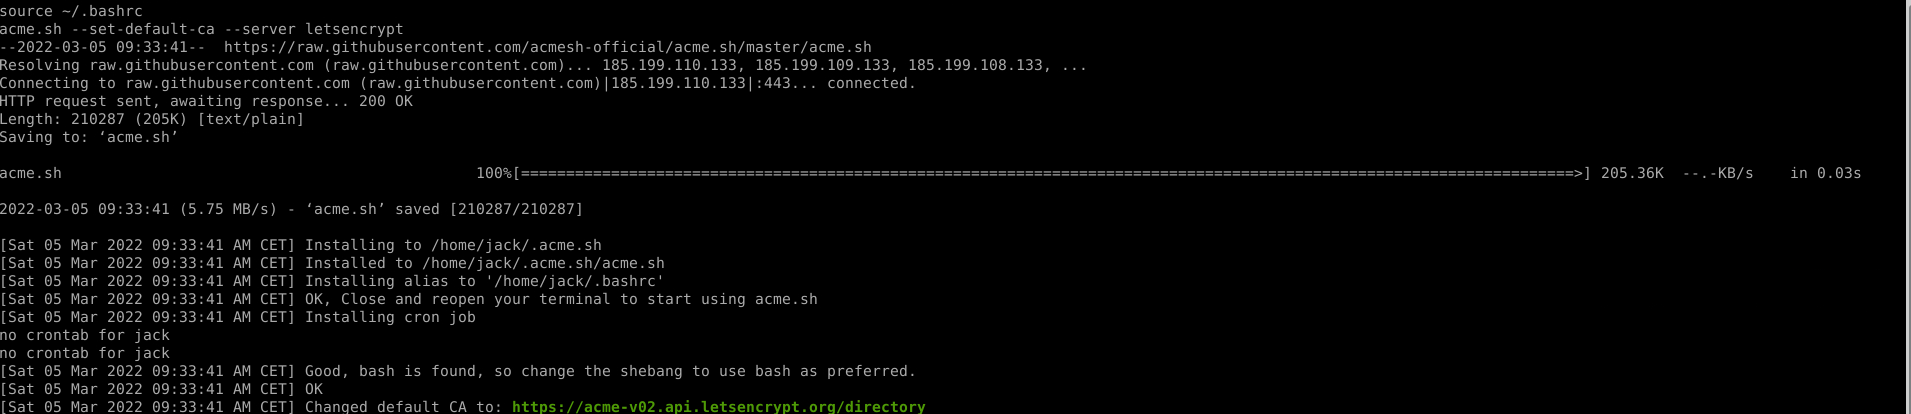
Setup Let’s Encrypt SSL
wget https://raw.githubusercontent.com/acmesh-official/acme.sh/master/acme.sh
bash acme.sh install
source ~/.bashrc
acme.sh --set-default-ca --server letsencrypt
Get SSL Certificate
acme.sh --issue --domain kibana.prod.atetux.com --domain elasticsearch.prod.atetux.com --standalone
wait until it finish and show the path of the SSL files
Your cert is in: /root/.acme.sh/kibana.prod.atetux.com/kibana.prod.atetux.com.cer
Your cert key is in: /root/.acme.sh/kibana.prod.atetux.com/kibana.prod.atetux.com.key
The intermediate CA cert is in: /root/.acme.sh/kibana.prod.atetux.com/ca.cer
Install Java JRE
Elastic search, kibana and logstash build using Java programming language, so we’ll need a java interpreter to run the application.
sudo apt install default-jre -y
Debian 11 comes with Java 11 by default, which can be verified by running
java --version
# output
openjdk 11.0.14 2022-01-18
OpenJDK Runtime Environment (build 11.0.14+9-post-Debian-1deb11u1)
OpenJDK 64-Bit Server VM (build 11.0.14+9-post-Debian-1deb11u1, mixed mode, sharing)
Import PGP Key
This pgp key will verify we’re using the official version from Elasticsearch, otherwise it’ll complain about the signing key later when installing using apt.
wget -qO - https://artifacts.elastic.co/GPG-KEY-elasticsearch | gpg --dearmor | sudo tee /usr/share/keyrings/elasticsearch.gpg
Config location for Elasticsearch, Kibana and Logstash
| # | Config File/Folder |
|---|---|
| Elasticsearch | /etc/elasticsearch and /etc/default/elasticsearch |
| Kibana | /etc/kibana and /etc/default/kibana |
| Logstash | /etc/logstash and /etc/default/logstash |
Add Elasticsearch Repository
Add the official Debian repository from Elastic, this repository keep updated when the new version coming, so we’re good for using this repository for production environment.
echo "deb [signed-by=/usr/share/keyrings/elasticsearch.gpg] https://artifacts.elastic.co/packages/8.x/apt stable main" | sudo tee /etc/apt/sources.list.d/elastic-8.x.list
update the apt metadata after add new repository
sudo apt update2. Install Elasticsearch
Install the elasticsearch using apt
sudo apt install elasticsearch -y
Wait until the installation is completed and password generated
Authentication and authorization are enabled.
TLS for the transport and HTTP layers is enabled and configured.

The generated password for the elastic built-in superuser is : 9mmWuutjuPIJ+eA8odGV
Start elasticsearch service
# enable on boot
sudo systemctl enable elasticsearch
# start the service
sudo systemctl start elasticsearch
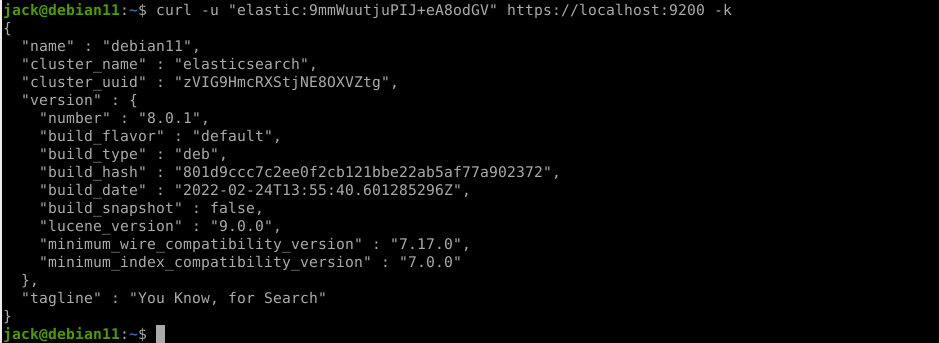
Test Query to Elasticsearch
curl -u "elastic:9mmWuutjuPIJ+eA8odGV" https://localhost:9200 -k
output from command above
{
  "name" : "debian11",
  "cluster_name" : "elasticsearch",
  "cluster_uuid" : "zVIG9HmcRXStjNE8OXVZtg",
  "version" : {
    "number" : "8.0.1",
    "build_flavor" : "default",
    "build_type" : "deb",
    "build_hash" : "801d9ccc7c2ee0f2cb121bbe22ab5af77a902372",
    "build_date" : "2022-02-24T13:55:40.601285296Z",
    "build_snapshot" : false,
    "lucene_version" : "9.0.0",
    "minimum_wire_compatibility_version" : "7.17.0",
    "minimum_index_compatibility_version" : "7.0.0"
  },
  "tagline" : "You Know, for Search"
}
Generate token for Kibana installation
sudo /usr/share/elasticsearch/bin/elasticsearch-create-enrollment-token -s kibana
# example
eyJ2ZXIiOiI4LjAuMSIsImFkciI6WyIxOTIuMTY4Ljg4LjM1OjkyMDAiXSwiZmdyIjoiZTA5ODUyYjZiYzc2NzNkODUxMTY5YjIxYmY3YWZmNTdjZmRlMzUyN2FlNzJjZTliYjczNmNhNDFiMjJlZmJjYSIsImtleSI6InltTXNXWDhCQ09TYlFRRmVTOV9wOm9XOC1Yakp6UU0tcy1SaDFwVlo0eEEifQ==
we’ll use this code to initial install Kibana, so it can connect to Elasticsearch.
3. Install Kibana
Kibana is the UI for Elasticsearch, we can make a dashboard, alert, and monitoring from Kibana. It’s so powerful and easy to use. From my experience, you can create a dashboard from scratch in less than a week, even for beginners.
Install Kibana using apt
sudo apt install kibana -y
Update the Kibana config, to enable access from outside the server. Update the following values
server.port: 5601
server.host: "0.0.0.0"
the start Kibana service since by default Elasticsearch repository didn’t start the service after installation.
Enable kibana on boot
# enable on boot
sudo systemctl enable kibana
# start the service
sudo systemctl start kibana
# check service status
sudo systemctl status kibana
check the log to get the initial installation link and code
sudo journalctl -u kibana -f
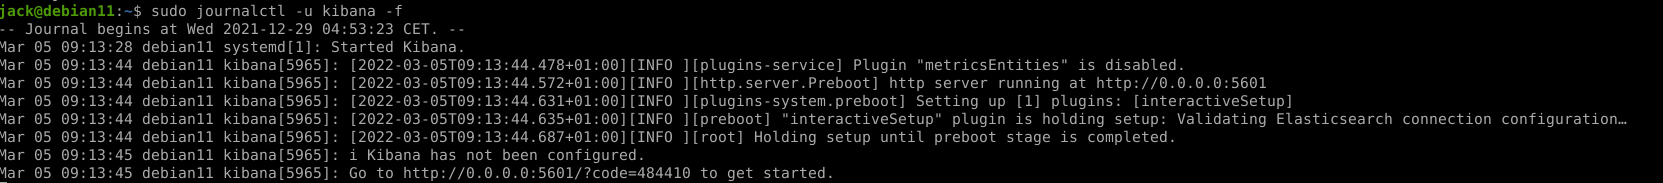
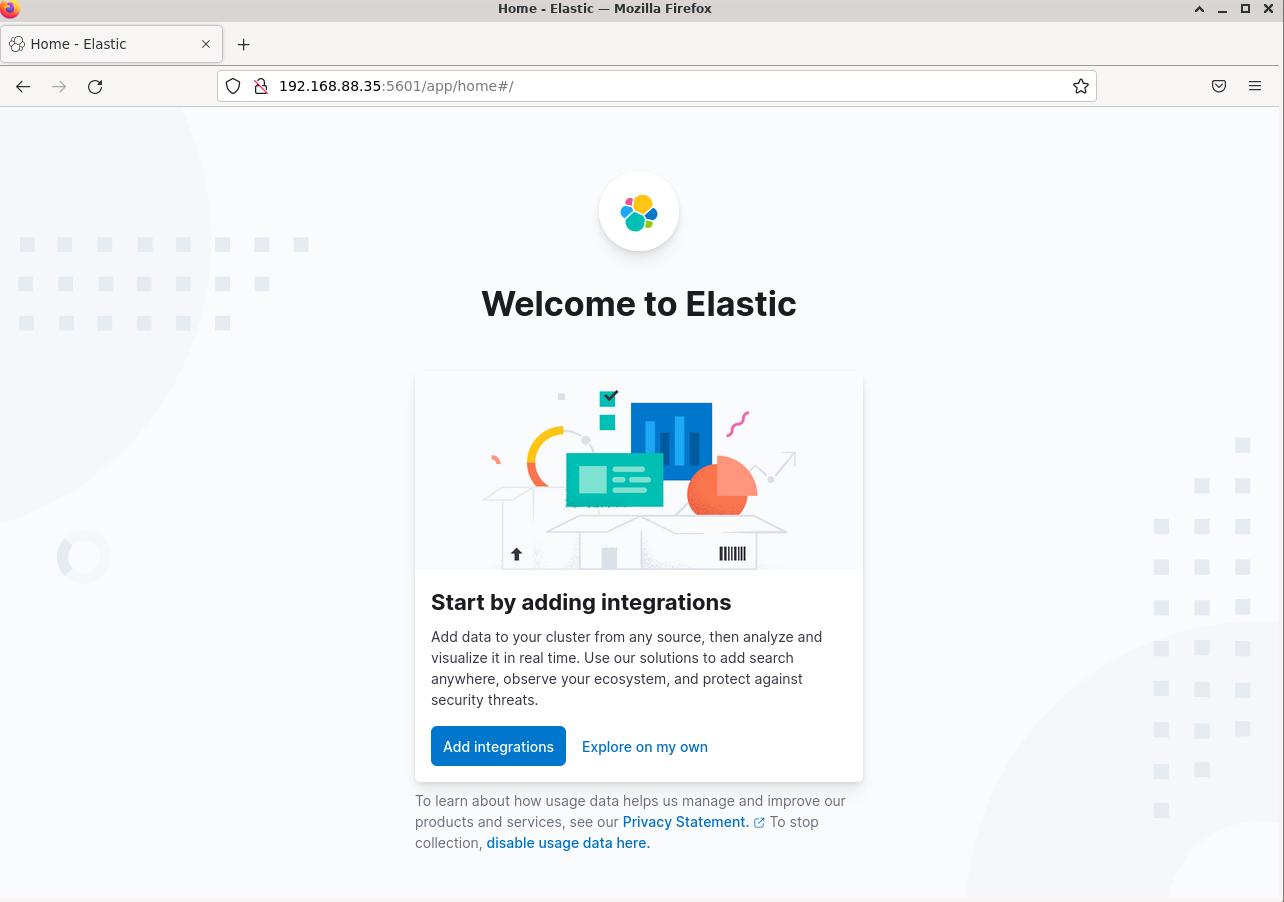
open the link, but replace the 0.0.0.0 with your Kibana IP address.
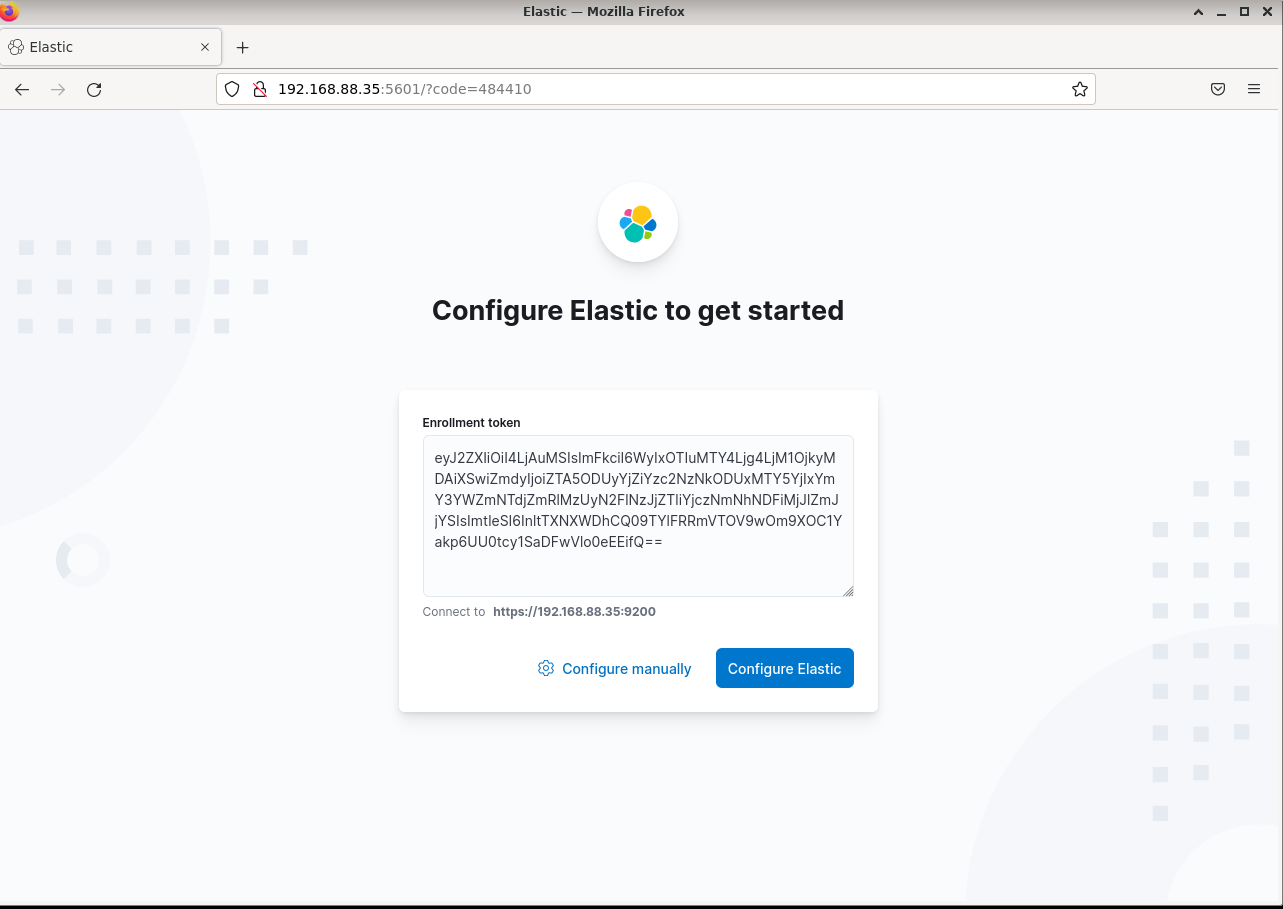
put the Kibana token that we generate earlier, the click Configure Elastic
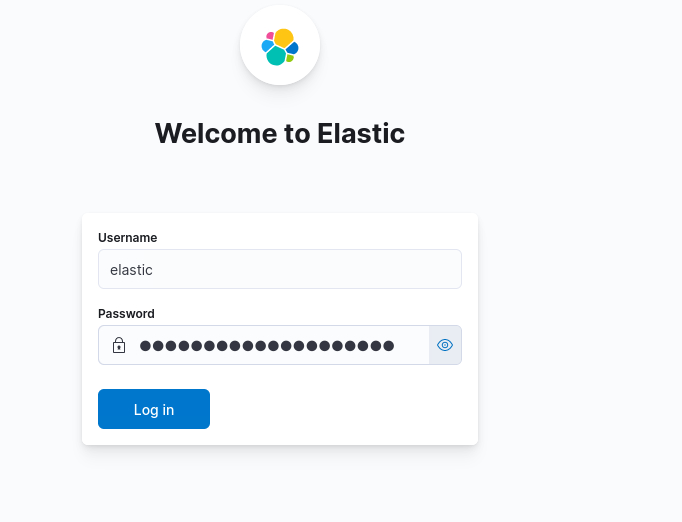
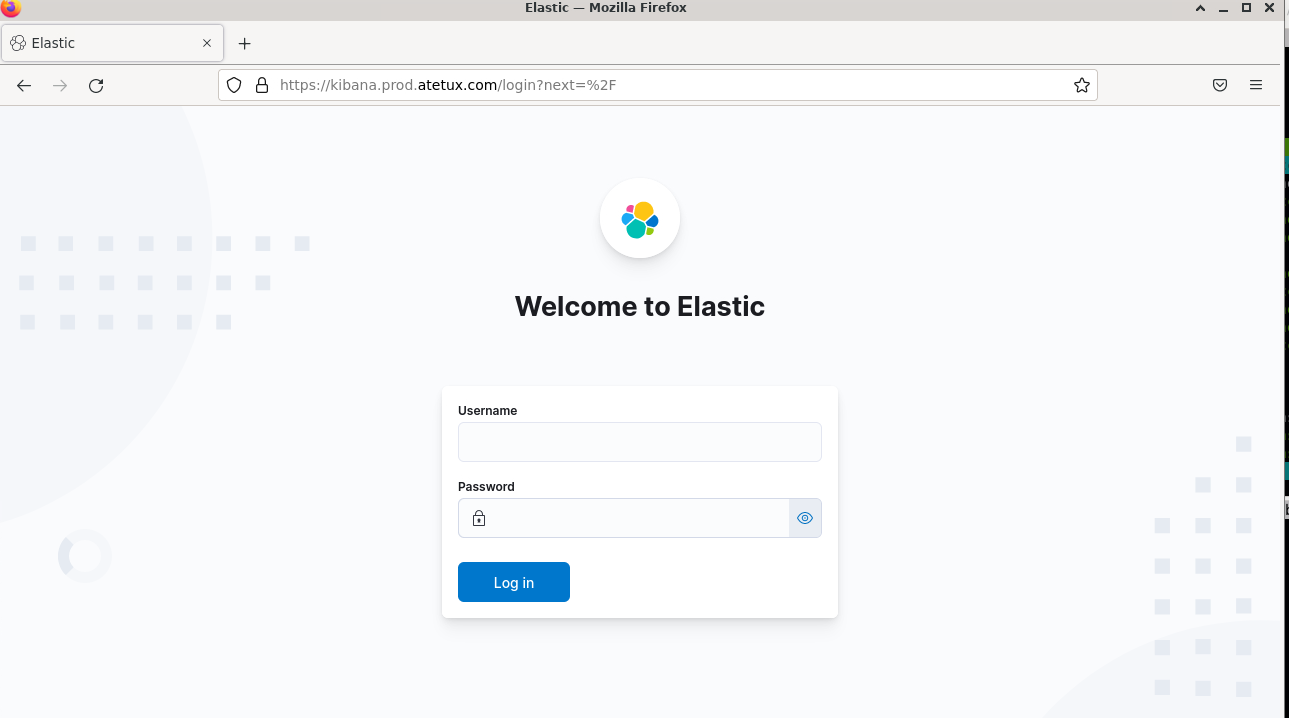
Wait till the login page appear, usually takes less than 2 minutes. Then use the username elastic and the password generated after Elastisearch installation
4. Install Nginx as Reverse Proxy
Install Nginx
sudo apt install nginx -y
Reverse Proxy for Elasticsearch
Create a new file /etc/nginx/sites-enabled/elasticsearch.DOMAIN.com, and put the following config
server {
    listen 443 ssl http2;
    server_name elasticsearch.prod.atetux.com;
    client_max_body_size 30M;
    location / {
        proxy_set_header HOST $host;
        proxy_set_header X-Real-IP $remote_addr;
        proxy_redirect off;
        proxy_pass https://localhost:9200;
    }
    ssl_certificate /root/.acme.sh/elasticsearch.prod.atetux.com/fullchain.cer;
    ssl_certificate_key /root/.acme.sh/elasticsearch.prod.atetux.com/elasticsearch.prod.atetux.com.key;
}
Reverse Proxy for Kibana
Create a new file /etc/nginx/sites-enabled/kibana.DOMAIN.com, and put the following config
server {
    listen 443 ssl http2;
    server_name kibana.prod.atetux.com;
    client_max_body_size 30M;
    location / {
        proxy_set_header HOST $host;
        proxy_set_header X-Real-IP $remote_addr;
        proxy_redirect off;
        proxy_pass http://localhost:5601;
    }
    ssl_certificate /root/.acme.sh/kibana.prod.atetux.com/fullchain.cer;
    ssl_certificate_key /root/.acme.sh/kibana.prod.atetux.com/kibana.prod.atetux.com.key;
}
Update Kibana config (/etc/kibana/kibana.yml), to listen to localhost only
server.port: 5601
server.host: "localhost"
Restart Kibana
sudo systemctl restart kibanaVerify and Restart Nginx
Restart Kibana
sudo nginx -t && sudo systemctl restart nginx
Now open your kibana from https://kibana.DOMAIN.com
Elasticsearch
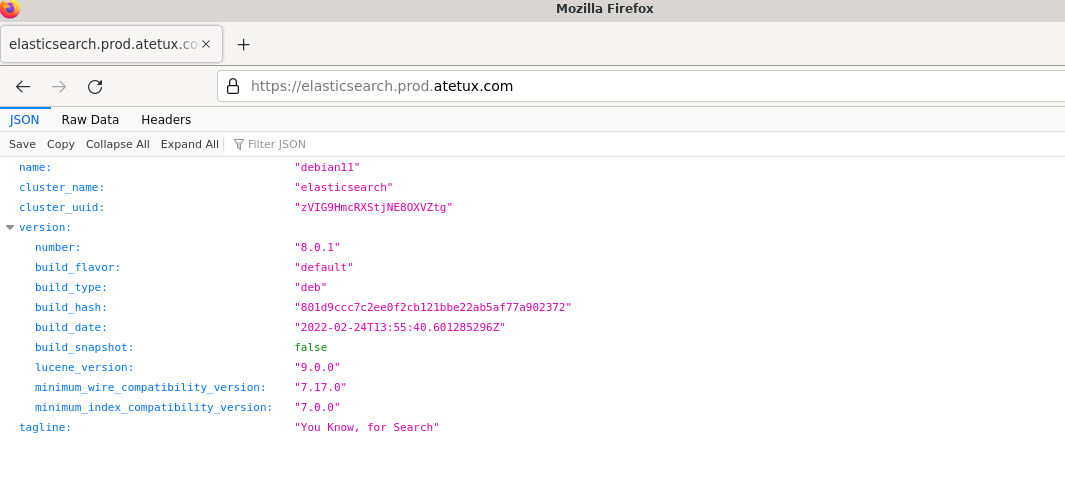
If you prefer using command line, replace localhost:9200 with domain name
curl -u "elastic:9mmWuutjuPIJ+eA8odGV" https://elasticsearch.prod.atetux.com
5. Install Logstash
After we have elasticsearch and kibana, now time to send some logs there. For this purpose, logstash is the app that can ship logs from any Linux distro to Elasticsearch
If you have multiple servers, you just need to add the Elasticsearch repository and install the logstash using the command line.
sudo apt install logstash -y
Logstash run as user logstash, to able send the logs logstash user will need permission to read the file/directory. For example we want logstash to send SSH logs to Elasticsearch, the log for SSH is at /var/log/auth.log, check the file permission
sudo ls -l /var/log/auth.log
-rw-r----- 1 root adm 25618 Mar  5 09:45 /var/log/auth.log
the group owner is adm, just add that group to logstash user
sudo usermod -a -G adm logstash
# verify
sudo id logstash
# output
uid=998(logstash) gid=998(logstash) groups=998(logstash),4(adm)
Add new config file for logstash in /etc/logstash/conf.d/ssh.conf
input {
    file {
        path => [
            "/var/log/auth.log"
        ]
        start_position => "beginning"
    }
}

output {
    stdout { codec => rubydebug }
    elasticsearch {
        hosts => "https://elasticsearch.prod.atetux.com:443"
        user => "elastic"
        password => "9mmWuutjuPIJ+eA8odGV"
        index => "server"
    }
}
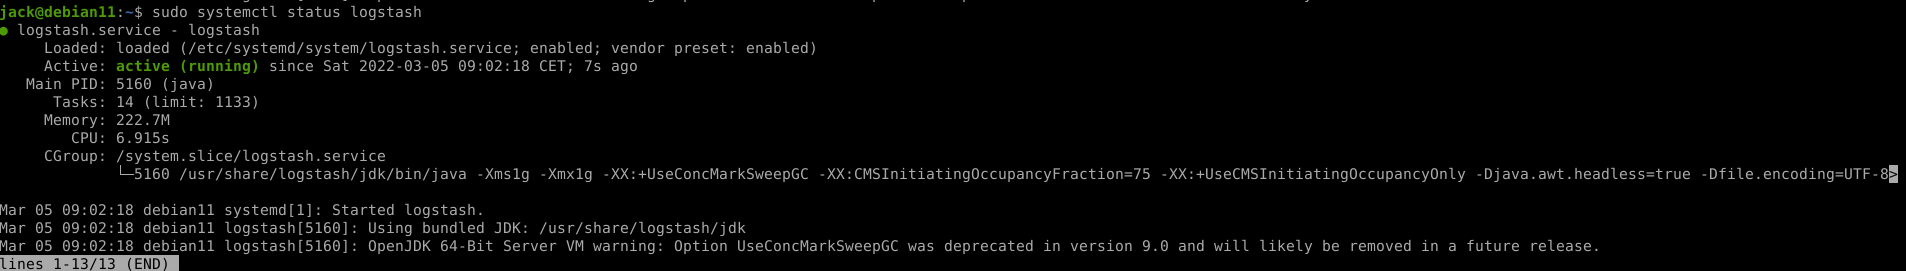
Restart logstash
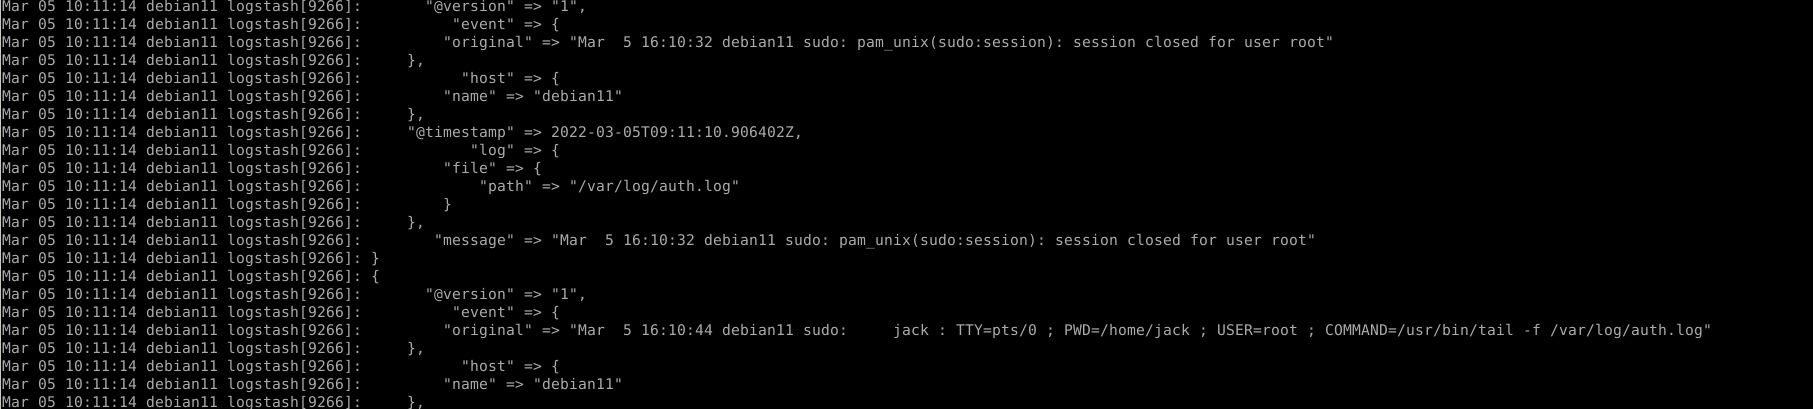
sudo systemctl restart logstashwait a minute until logstash running, the run journalctl
sudo journalctl -u logstash -f
Check the data from server index:
1. Using curl
curl -u "elastic:9mmWuutjuPIJ+eA8odGV" https://elasticsearch.prod.atetux.com/server/_search
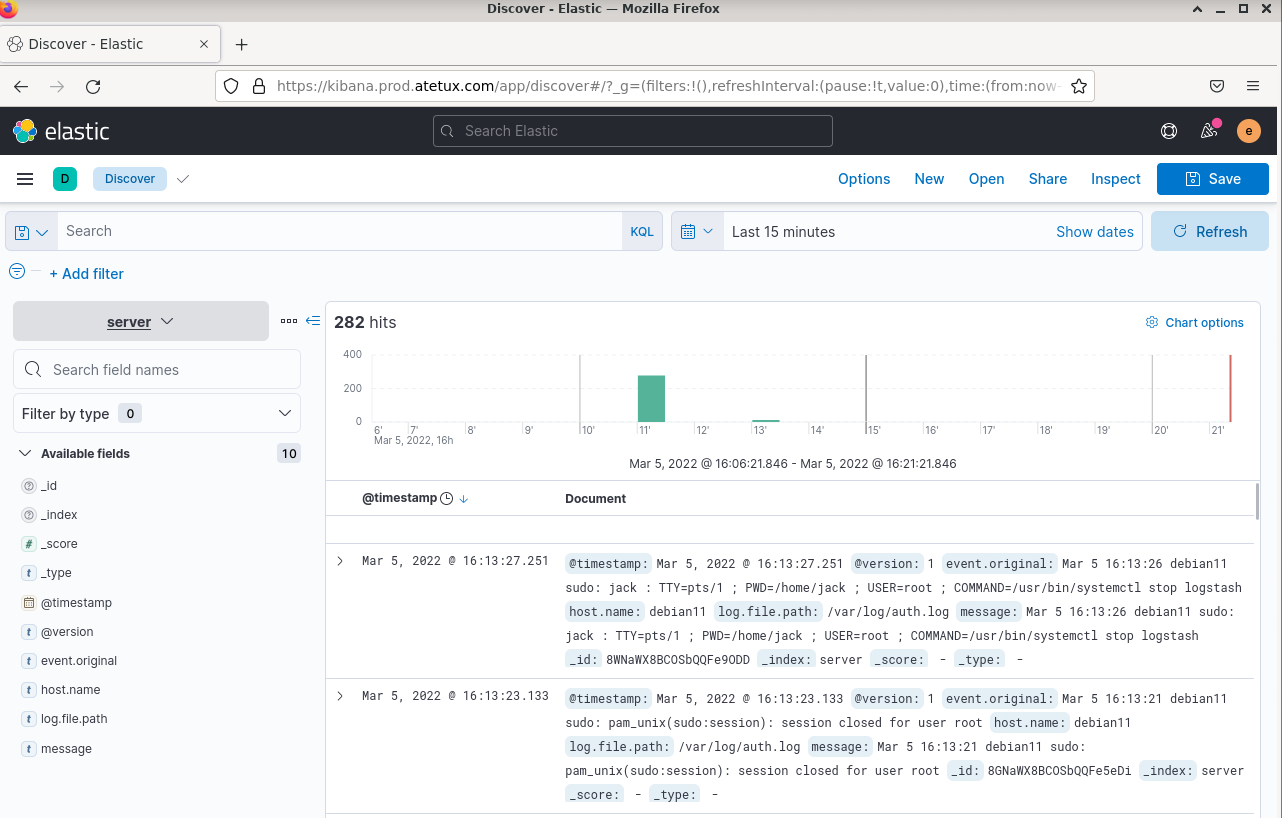
2. Using Kibana
For the first add the index to Kibana data view from menu Kibana -> Stack Management -> Kibana -> Data Views
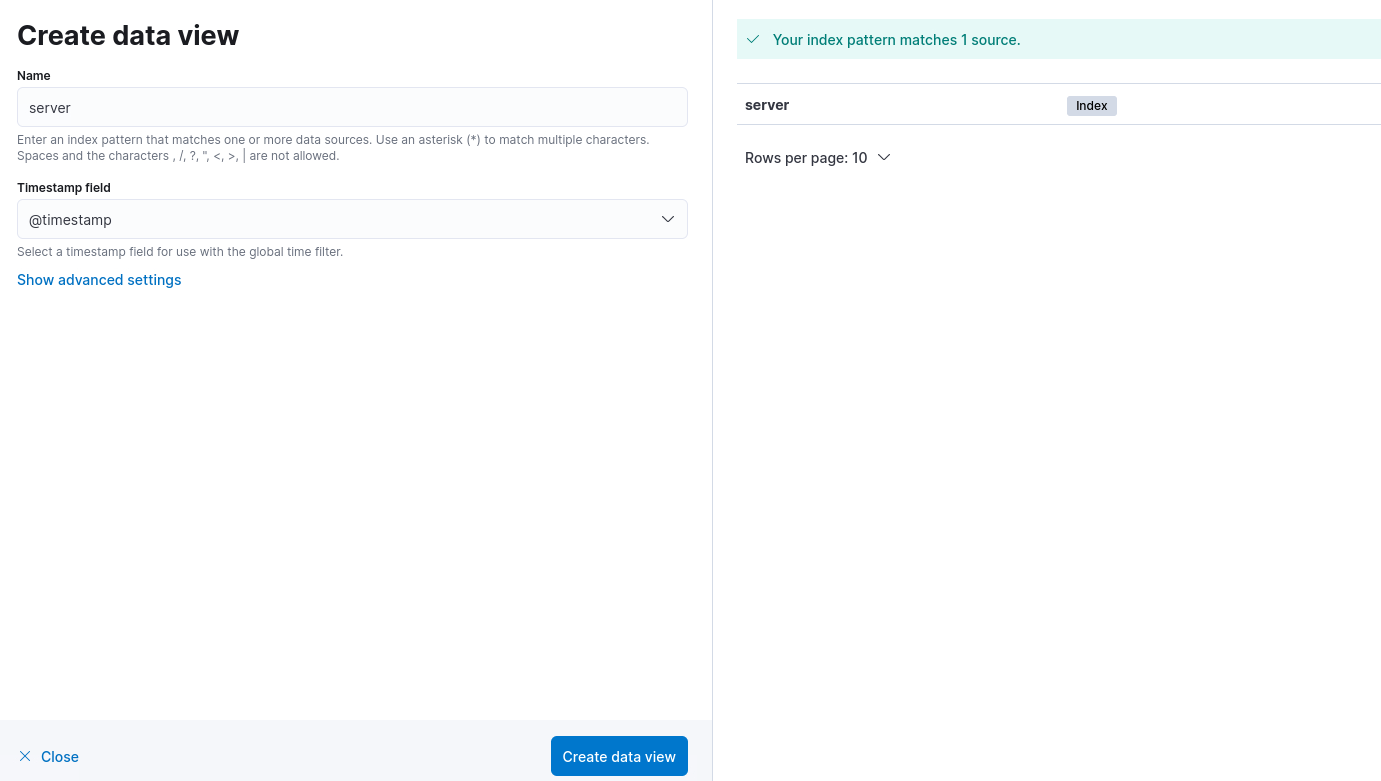
click Create data view
Then open menu Discover, change the index to server
Excuse me, how am I supposed to setup DNS for Elasticsearch and Kibana with given Tipe, Name and Content (IP)?
What do you mean by setup DNS for elasticsearch? Care to elaborate more